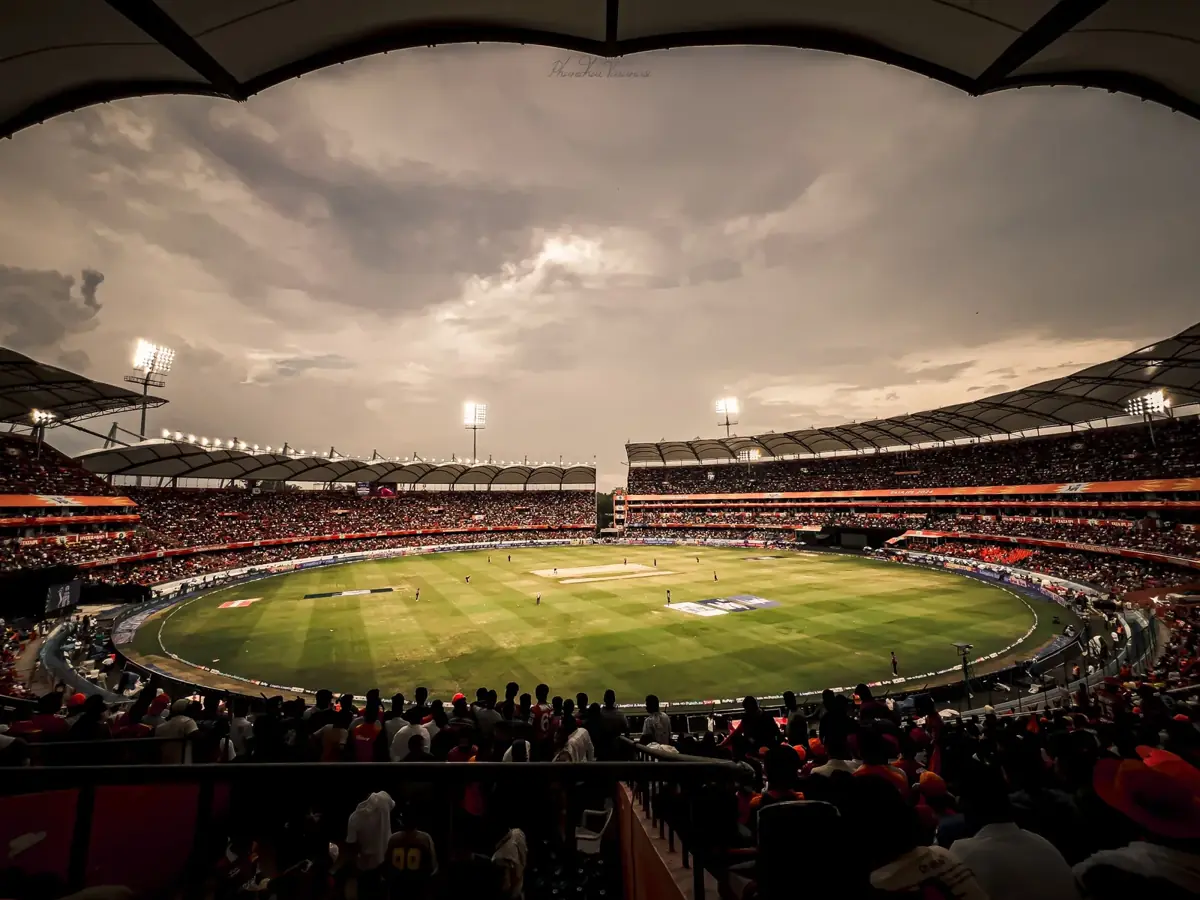
The Rajiv Gandhi International Cricket Stadium in Uppal, Hyderabad, has produced high-scoring men's T20 internationals, but its record does not guarantee a big total in every match. Across four completed T20Is, the average first-innings score is 234.25 and the median is 227. India's 297/6 against Bangladesh in 2024 remains the highest total at the venue.
The latest T20I, played on 14 October 2026, saw West Indies score 247/3 before restricting India to 223 in a 24-run victory. The result adds another high-scoring match to the venue's record, while also showing why batting conditions alone cannot explain a result: bowling execution and the chase matter too.
This guide separates Hyderabad's T20I history from IPL results and explains the venue's scoring trends, pace-versus-spin records and match-day factors. Historical figures describe what has happened here; they do not confirm the condition of the next pitch.
Rajiv Gandhi Stadium Pitch Report at a Glance
Past totals do not reveal the grass, moisture or hardness of the next selected strip.
297/6 raises the mean; the median averages the two middle totals, 207 and 247.
Includes medium pace and part-time seam; more wickets do not prove a pace-favouring strip.
Spin conceded fewer runs per over in this sample; that alone does not establish turn.
The result does not establish that dew helped West Indies or determined the chase.
Four men’s T20Is inform these averages. IPL innings are shown separately and do not enlarge the sample.
Checked 15 October 2026. The four completed men’s T20Is were played on 6 December 2019, 25 September 2022, 12 October 2024 and 14 October 2026. The sample contains eight innings and excludes IPL, women’s matches and the Dehradun ground.
Pitch Nature and Surface Conditions
Rajiv Gandhi International Cricket Stadium has demonstrated the potential for explosive T20 batting, but high scores alone do not tell the complete story of its pitch. India’s 297/6 in a 2024 T20I and Sunrisers Hyderabad’s 286/6 in the 2025 IPL illustrate the scoring ceiling at this venue. However, these performances do not establish whether the strip prepared for the next match will be hard, dry, grassy or slow.
The completed fourth T20I on 14 October 2026 produced West Indies 247/3 and India 223. Those scores show the scoring potential, while Keemo Paul’s 5/41 and Gudakesh Motie’s 2/13 show that wickets still shaped the result. They do not certify the condition of the next strip or establish that it will favour pace or spin.
Scoring History vs Match-Day Surface
Big scores show the venue’s potential—not the condition of the next strip.
match dayNo verified strip inspection
match dayNot established by scores
For the next Hyderabad fixture, assess a dated surface inspection and the selected playing XIs. The 14 October result is historical evidence, not a new-pitch verdict.
What the T20I bowling data reveals
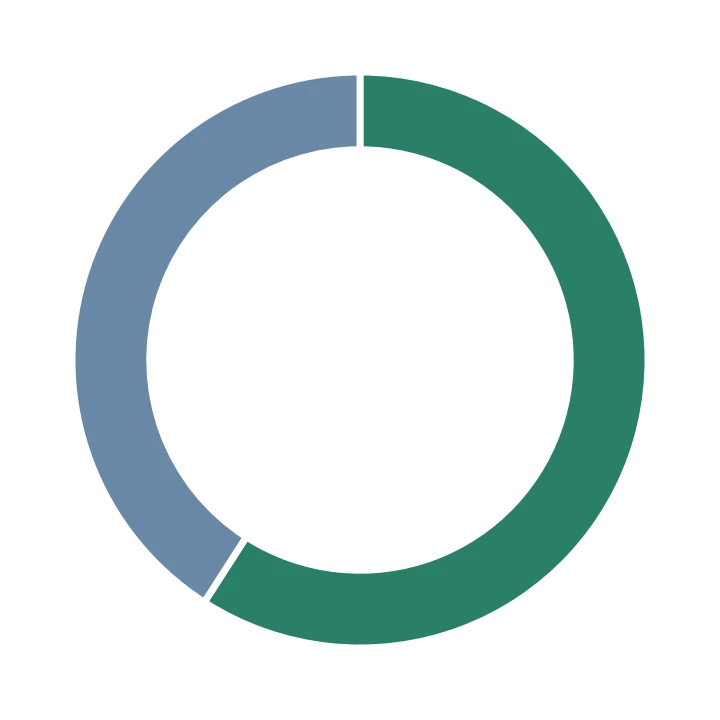
In the four-match men’s T20I sample, spinners have taken 18 bowler-credited wickets at a combined economy of 9.75. Pace bowlers have taken 26 at 11.16. Spin contributed wickets and conceded fewer runs per over, but the unequal workloads and small sample do not establish how much turn a particular surface provides.
Pace vs Spin: Wicket Share
Separate venue history from match-day evidence. Past scores describe completed matches; a dated inspection, selected XIs and actual conditions inform the next fixture.
Batting vs Bowling: Who Has the Advantage?
The scoring record is high, but conditions do not decide results alone. All four first innings reached at least 186; three exceeded 200. West Indies successfully defended 247/3 in the latest match.
First vs Second Innings
| Measure | First innings | Second innings |
|---|---|---|
| Average score | 234.25 | 195.75 |
| Median first-innings total | 227 | Not a par-score prediction |
| Bowler-credited wickets (total) | 20 | 24 |
| Highest total | 297/6 — India | 223 — India |
| Lowest total | 186/7 — Australia | 164/7 — Bangladesh |
| Bowling type | Legal balls | Runs conceded | Credited wickets | Economy |
|---|---|---|---|---|
| Spin | 354 | 575 | 18 | 9.75 |
| Pace | 594 | 1105 | 26 | 11.16 |
The 2019 and 2022 successful chases finished before 20 overs, so a lower second-innings average is not proof that batting becomes harder. Economy uses runs charged to bowlers, including wides and no-balls but excluding byes and leg-byes; 19.3 overs means 117 legal balls, not 19.3 decimal overs. The wickets row counts only bowler-credited dismissals. India’s 2026 score is shown as 223 because the sources differ on Arshdeep Singh’s retirement classification.
Dew Factor and Weather Conditions
The fourth T20I took place on 14 October 2026 at 7:00 PM IST. West Indies won by 24 runs. The table below is an archived pre-match IMD city forecast issued on 12 October, not observed stadium conditions or a forecast for the next match. See the Hyderabad weather guide for the dated forecast context.
| Forecast item | Published value | What it means for the match |
|---|---|---|
| Daily minimum / maximum | 19°C / 32°C | Daily range, not the temperature at 7:00 PM. |
| Sky condition | Partly cloudy sky with haze | City forecast; not an observation at the Uppal ground. |
| Relative humidity at 08:30 / 17:30 | 70% / 30% | Two scheduled readings, not late-evening humidity. |
| Weather warning | No warning | Does not mean a guaranteed rain-free match. |
| Rain probability / stadium dew | Not supplied in this forecast | No numeric rain chance or confirmed dew is claimed. |
No verified evidence establishes dew as the reason for the West Indies win. Moisture can affect grip and execution if present, but an evening start and the final scores do not confirm its role. For a future fixture, use current weather information and observed outfield conditions. See the weather guide, seating guide and Metro guide for separate visitor context.
Rajiv Gandhi Stadium Pitch Report: Average Score and Competitive Total
Hyderabad T20I Scoring Records
| Statistic | Value | Scope / explanation |
|---|---|---|
| First-innings average | 234.25 | (207 + 186 + 297 + 247) ÷ 4. |
| First-innings median | 227 | Sorted totals: 186, 207, 247, 297; (207 + 247) ÷ 2. |
| First-innings average without 297 | 213.33 | (207 + 186 + 247) ÷ 3; sensitivity check, not a replacement average. |
| Highest team total | India 297/6 | Against Bangladesh, 12 October 2024. |
| Lowest completed innings | Bangladesh 164/7 | Against India, 12 October 2024. |
| Highest successful chase | India 209/4 chasing 208 | Against West Indies, 6 December 2019. |
| Wins batting first / chasing | 2 / 2 | Four completed matches; chasing share 50%. |
| Bowler-credited wickets | 44 | 26 pace + 18 spin; run-outs and retirements excluded. |
The 234.25 mean and 227 median describe different features of the same small sample. The mean uses all four totals; the median lies halfway between 207 and 247. Removing the unusually high 297 innings lowers the mean to 213.33, showing its influence. Neither number is a guaranteed winning total or a prediction for the next strip.
Recent IPL innings provide a separate warning about the ceiling: SRH made 235/4 on 6 May 2026 and 255/4 on 22 May 2026, winning both. Those results are IPL evidence, not additional T20I observations and not an all-season average. Compare the format-specific totals on the Rajiv Gandhi Stadium records page.
Last Matches at the Ground: T20Is and Recent IPL Results
The verified Hyderabad sample now contains four completed men’s T20Is. The first table shows all four, including the 14 October 2026 result. The IPL results remain in a separate competition table.
All completed Hyderabad men’s T20Is
| Date | Competition | Teams | First innings | Second innings | Result | Format |
|---|---|---|---|---|---|---|
| 2026-10-14 | West Indies tour of India | West Indies vs India | West Indies 247/3 (20) | India 223 (19.3) | West Indies won by 24 runs | T20I |
| 2024-10-12 | Bangladesh tour of India | India vs Bangladesh | India 297/6 (20) | Bangladesh 164/7 (20) | India won by 133 runs | T20I |
| 2022-09-25 | Australia tour of India | Australia vs India | Australia 186/7 (20) | India 187/4 (19.5) | India won by 6 wickets | T20I |
| 2019-12-06 | West Indies tour of India | West Indies vs India | West Indies 207/5 (20) | India 209/4 (18.4) | India won by 6 wickets | T20I |
Latest completed IPL matches at Hyderabad
| Date | Competition | Teams | First innings | Second innings | Result | Format |
|---|---|---|---|---|---|---|
| 2026-05-22 | Indian Premier League | Sunrisers Hyderabad v Royal Challengers Bengaluru | SRH 255/4 (20 overs) | RCB 200/4 (20 overs) | Sunrisers Hyderabad won by 55 runs | IPL T20 |
| 2026-05-06 | Indian Premier League | Sunrisers Hyderabad v Punjab Kings | SRH 235/4 (20 overs) | PBKS 202/7 (20 overs) | Sunrisers Hyderabad won by 33 runs | IPL T20 |
The 2019 and 2022 T20Is ended in successful chases; 2024 and 2026 ended in successful defences. In the latest match, Shai Hope was Player of the Match for 102* from 50 balls, Keemo Paul took 5/41, and Sanju Samson made 56 from 23. The size of the target and execution matter alongside the toss. See the completed fourth-T20I result and Hyderabad stadium matches.
Ground Records and Best Performers
Venue coverage by format
| Format | Verified coverage | Highest team innings | Highest individual / best bowling |
|---|---|---|---|
| Men’s Test | 6 matches; latest starts 25 Jan 2024 | India 687/6 declared | Brendon McCullum 225 / Tom Hartley 7/62 (innings). |
| Men’s ODI | 10 matches; latest 10 Oct 2023 | Australia 350/4 | Shubman Gill 208 / Mitchell Santner 5/59. |
| Men’s T20I | 4 matches; latest 14 Oct 2026 | India 297/6 | Sanju Samson 111 / Keemo Paul 5/41. |
| IPL | IPL results tracked separately | SRH 286/6 | Abhishek Sharma 141 / Alzarri Joseph 6/12. |
The T20I rows use only the four completed men’s internationals at Uppal. Tests, ODIs and IPL records remain separate. Review the format-specific stadium records for venue context.
Leading run-scorers in Hyderabad men’s T20Is
| Player | Innings | Runs | Balls | Strike rate | Highest |
|---|---|---|---|---|---|
| Sanju Samson | 2 | 167 | 70 | 238.57 | 111 |
| Virat Kohli | 2 | 157 | 98 | 160.20 | 94* |
| Suryakumar Yadav | 2 | 144 | 71 | 202.82 | 75 |
| Shai Hope | 1 | 102 | 50 | 204.00 | 102* |
| Shimron Hetmyer | 2 | 89 | 53 | 167.92 | 56 |
Leading wicket-takers in Hyderabad men’s T20Is
| Player | Matches bowled | Wickets | Best innings | Economy |
|---|---|---|---|---|
| Keemo Paul | 1 | 5 | 5/41 | 10.25 |
| Axar Patel | 2 | 4 | 3/33 | 9.75 |
| Ravi Bishnoi | 1 | 3 — tied on 3 | 3/30 | 7.50 |
| Tanzim Hasan Sakib | 1 | 3 — tied on 3 | 3/66 | 16.50 |
| Yuzvendra Chahal | 2 | 3 — tied on 3 | 2/36 | 7.25 |
Rajiv Gandhi Stadium Pitch Report: Final Pitch Verdict for India vs West Indies
Batting lean. Spin still matters.
Historical trends guide the assessment; the selected strip decides the match-day outlook.
Batting-friendly record
The historical lean is towards batting, with spin still important. Fast bowlers need to execute under a scoring record that has often been demanding.
Spin has a role
Spinners have conceded fewer runs per over in the small T20I sample. Neither statistic confirms early swing, later turn or the condition of a fresh strip.
Two of four T20Is won chasing
Batting-first and chasing teams have each won twice. The sample does not establish an automatic chase-first strategy.
West Indies won by 24 runs
- West Indies 247/3; India 223
- Shai Hope 102* (50), Player of the Match
- Keemo Paul 5/41
These are observed performances, not proof that the pitch favoured pace or that dew decided the match.
This Rajiv Gandhi Stadium Pitch Report offers a reasoned venue assessment, not a guaranteed result or a fixed score prediction.
Explore the player context
Keep current-series performances separate from Hyderabad ground records.
Frequently Asked Questions
Is Rajiv Gandhi Stadium a batting or bowling pitch?
The four completed Hyderabad men’s T20Is show high scoring: a 234.25 first-innings mean and 227 median. Historical scores do not establish the condition of the next strip. Spinners have taken 18 of the 44 bowler-credited wickets.
What is the average T20I score at Rajiv Gandhi Stadium Hyderabad?
Across the four completed men’s T20Is in 2019, 2022, 2024 and 2026, the first-innings mean is 234.25 and the median is 227. The second-innings mean is 195.75. India’s 297/6 increases the first-innings mean.
What is the highest T20I score at Rajiv Gandhi Stadium?
India’s 297/6 against Bangladesh on 12 October 2024 remains the highest team total in the completed Hyderabad men’s T20I sample. Sanju Samson made 111 from 47 balls.
What is the lowest T20I score at Rajiv Gandhi Stadium?
Bangladesh’s 164/7 against India on 12 October 2024 is the lowest of the eight completed innings in these four Hyderabad men’s T20Is. IPL and Dehradun records are excluded.
Does Rajiv Gandhi Stadium favour pace or spin?
Pace bowlers have taken 26 wickets from 594 legal balls at 11.16 runs per over; spin has taken 18 from 354 balls at 9.75. Different workloads, bowlers and match situations mean these figures alone do not prove a pace- or spin-favouring strip.
Is chasing better at Rajiv Gandhi Stadium?
Chasing and batting-first teams have each won two of the four completed Hyderabad men’s T20Is. India chased targets of 208 and 187 in 2019 and 2022, defended 297/6 in 2024, and West Indies defended 247/3 in 2026. This is not a guaranteed toss strategy.
Did dew help West Indies in the fourth T20I?
No verified stadium observation establishes that dew caused the outcome on 14 October 2026. The archived IMD city forecast is not a ground-specific dew reading. The completed scorecard cannot prove a dew advantage.
What is the highest IPL score at Rajiv Gandhi Stadium?
Sunrisers Hyderabad made 286/6 against Rajasthan Royals on 23 March 2025. Abhishek Sharma’s 141 against Punjab Kings on 12 April 2025 is the verified highest individual IPL innings at this venue; Alzarri Joseph’s 6/12 is the best bowling figure.
A high-scoring venue still gives spinners a role
Hyderabad’s four completed men’s T20Is have a 234.25 first-innings mean and 227 median. India’s 297/6 affects the mean, while the latest 247/3 was successfully defended. Pace has 26 bowler-credited wickets and spin 18, with spin conceding fewer runs per over in this sample. None of those figures confirms the next strip’s condition or explains a result without bowling execution and batting decisions.