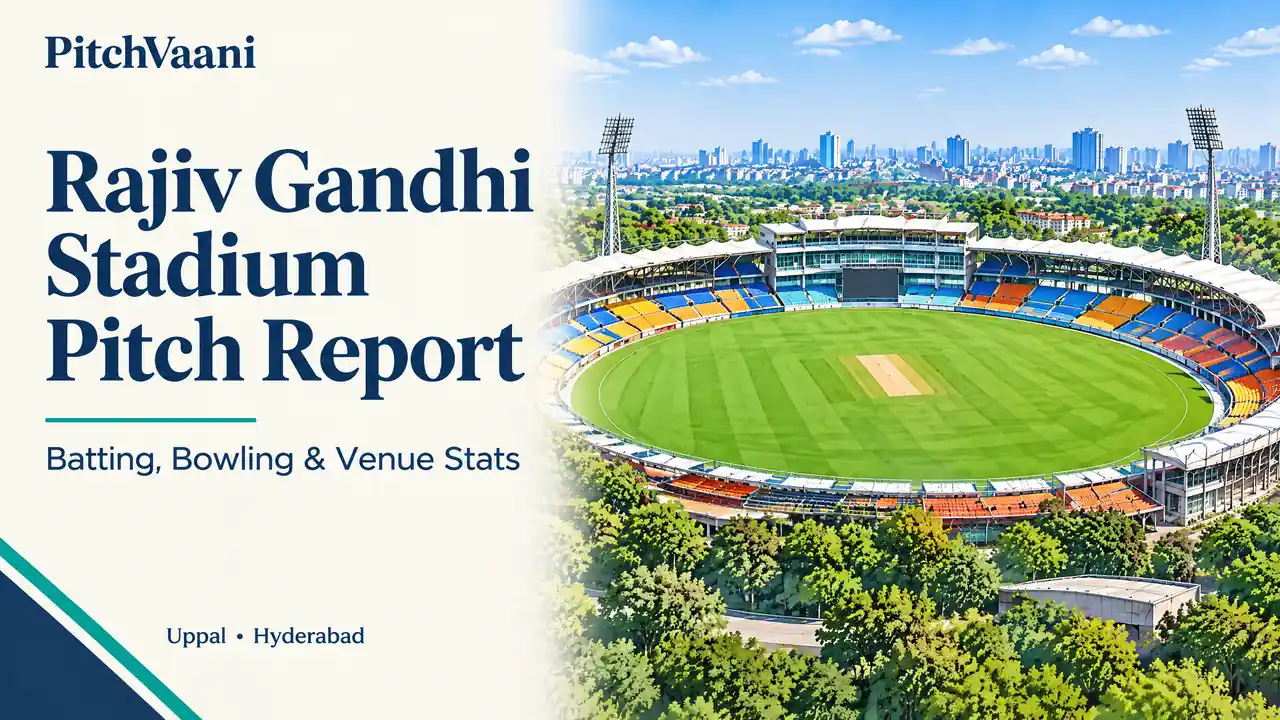

Rajiv Gandhi International Stadium IPL Records: Overview
The Rajiv Gandhi International Stadium IPL Records are led by SRH’s 286/6, Abhishek Sharma’s 141 and Alzarri Joseph’s 6/12. David Warner has the most runs at Hyderabad’s Uppal ground, while Bhuvneshwar Kumar leads the wicket-taking list.
This IPL-only guide covers matches through 22 May 2026. For the ground’s location and wider history, see the Rajiv Gandhi International Cricket Stadium overview. International figures are kept separate in our Rajiv Gandhi Stadium T20I records.
| IPL record | Record holder / figure |
|---|---|
| Highest team total | 286/6 — SRH vs RR, 23 March 2025 |
| Lowest team total | 80 all out — Delhi Daredevils vs SRH, 4 May 2013 |
| Highest individual score | 141 — Abhishek Sharma vs PBKS, 12 April 2025 |
| Most IPL runs | David Warner — 1,623 runs in 32 innings |
| Most IPL wickets | Bhuvneshwar Kumar — 48 wickets |
| Best bowling figures | 6/12 — Alzarri Joseph for MI vs SRH, 6 April 2019 |
| Most sixes / fours | David Warner: 72 sixes · Shikhar Dhawan: 166 fours |
| Highest successful chase | SRH 247/2 chasing a target of 246 vs PBKS, 12 April 2025 |
| Highest total defended | SRH 286/6 vs RR — won by 44 runs |
| First-innings average / median | 169.71 / 165 — 87 completed matches with 20-over allocations |
| Venue dataset | 90 matches with play · 89 decided · 1 no result |
| Latest completed venue IPL match | 22 May 2026 — SRH 255/4 beat RCB 200/4 by 55 runs |
Data scope: The 90 ball-by-ball match files contain 89 decided games and one no result. A separate abandoned fixture on 16 May 2024 had no play and is not included. The 87-match scoring sample excludes the two D/L-adjusted games and the no result; it includes all-outs, early successful chases and one match decided by a Super Over.
1. Rajiv Gandhi Stadium IPL Records: Highest and Lowest Totals
SRH own the three highest team totals in the venue dataset. Their 286/6 against Rajasthan Royals in 2025 surpassed the 277/3 made against Mumbai Indians in 2024. The latest venue match in 2026 added 255/4 to the top of the list.
| Team | Total | Opponent | Date |
|---|---|---|---|
| SRH | 286/6 | RR | 23 Mar 2025 |
| SRH | 277/3 | MI | 27 Mar 2024 |
| SRH | 255/4 | RCB | 22 May 2026 |
| SRH | 247/2 | PBKS | 12 Apr 2025 |
| MI | 246/5 | SRH | 27 Mar 2024 |
At the other end, Delhi Daredevils’ 80 all out remains the lowest IPL total at Uppal. SRH’s 96 all out on 6 April 2019 is also important: that was the innings in which Alzarri Joseph took 6/12. Short successful chases are not failed batting innings, so SRH’s 81/4 while chasing 81 is not treated as a batting collapse.
2. Batting Records: Who Dominates at Hyderabad?
Most IPL runs at Rajiv Gandhi Stadium
| Batter | Innings | Runs | Average | Strike rate | Highest |
|---|---|---|---|---|---|
| David Warner | 32 | 1,623 | 64.92 | 160.53 | 126 |
| Shikhar Dhawan | 47 | 1,477 | 36.93 | 124.22 | 99* |
| Heinrich Klaasen | 22 | 943 | 55.47 | 177.92 | 104 |
| Abhishek Sharma | 26 | 821 | 35.70 | 208.91 | 141 |
| Travis Head | 19 | 669 | 37.17 | 172.42 | 89* |
Warner’s 1,623 runs at an average of 64.92 show sustained production across 32 innings. Abhishek Sharma holds the higher individual peak of 141 and has scored his venue runs at a much faster strike rate of 208.91. Those records answer different questions: Warner leads on accumulated output; Abhishek leads the qualified strike-rate list and the highest-innings list.
Highest individual IPL scores
| Batter | Score (balls) | Team vs opponent | Date |
|---|---|---|---|
| Abhishek Sharma | 141 (55) | SRH vs PBKS | 12 Apr 2025 |
| Abhishek Sharma | 135* (68) | SRH vs DC | 21 Apr 2026 |
| David Warner | 126 (59) | SRH vs KKR | 30 Apr 2017 |
| Virender Sehwag | 119 (56) | Delhi Daredevils vs Deccan Chargers | 5 May 2011 |
| Andrew Symonds | 117* (53) | Deccan Chargers vs RR | 24 Apr 2008 |
| Jonny Bairstow | 114 (56) | SRH vs RCB | 31 Mar 2019 |
| David Warner | 109* (54) | Delhi Daredevils vs Deccan Chargers | 10 May 2012 |
| Cooper Connolly | 107* (59) | PBKS vs SRH | 6 May 2026 |
Highest visiting-team innings: Virender Sehwag made 119 for Delhi Daredevils against Deccan Chargers on 5 May 2011. Warner’s 109* in 2012 was also a visiting-team innings for Delhi. A player’s current or best-known franchise does not determine which team he represented in an earlier scorecard.
Fastest century, most boundaries and qualified strike rate
| Batting record | Verified figure |
|---|---|
| Fastest IPL century at the venue | Abhishek Sharma — 40 balls vs PBKS, 12 April 2025; finished with 141 (55) |
| Most sixes | David Warner — 72; Abhishek Sharma 61; Heinrich Klaasen 54 |
| Most fours | Shikhar Dhawan — 166; David Warner 151; Travis Head 80 |
| Best strike rate, minimum 10 innings | Abhishek Sharma — 208.91 (26 innings) |
| Next qualified strike rates | Heinrich Klaasen — 177.92 (22 innings); Travis Head — 172.42 (19 innings) |
Strike rate is batter runs per 100 balls faced. The minimum of 10 innings prevents a tiny cameo sample from topping this comparison. Abhishek reached his 2025 hundred in 40 balls; his final innings lasted 55 balls. The two figures should not be confused.
3. Bowling Records: Can Bowlers Succeed Here?
| Bowler | Bowling innings | Wickets | Best | Average | Economy |
|---|---|---|---|---|---|
| Bhuvneshwar Kumar | 50 | 48 | 5/19 | 31.52 | 8.04 |
| Amit Mishra | 27 | 30 | 3/19 | 24.03 | 7.19 |
| Rashid Khan | 22 | 28 | 3/19 | 20.96 | 6.67 |
| Dale Steyn | 24 | 27 | 3/8 | 21.19 | 6.30 |
| Siddarth Kaul | 15 | 21 | 4/29 | 19.57 | 7.01 |
Bhuvneshwar Kumar leads with 48 wickets, but the sustained record is not pace-only. Leg-spinners Amit Mishra and Rashid Khan have 30 and 28 wickets respectively. Rashid’s 6.67 economy is lower than Bhuvneshwar’s 8.04; differences in era and bowling role matter when comparing them.
Best IPL bowling figures
| Bowler | Figures | Date |
|---|---|---|
| Alzarri Joseph | 6/12 | 6 Apr 2019 |
| Ankit Rajpoot | 5/14 | 26 Apr 2018 |
| James Faulkner | 5/16 | 17 May 2013 |
| Bhuvneshwar Kumar | 5/19 | 17 Apr 2017 |
| Jaydev Unadkat | 5/30 | 6 May 2017 |
Consistency threshold: Among bowlers with at least 15 venue wickets and 10 bowling innings, Siddarth Kaul has the best average at 19.57; Dale Steyn has the best economy at 6.30. Joseph’s 2.00 bowling average comes from one appearance and is a single-match outlier, not evidence of long-term consistency.
The ball-by-ball phase totals also put Bhuvneshwar first for both powerplay wickets (20) and wickets in overs 16–20 (26). These are wickets credited to the bowler; run-outs are not counted as bowling wickets.
4. Team-wise IPL Records and SRH’s Home Performance
| Team / franchise | Decided | Wins | Losses | Win rate |
|---|---|---|---|---|
| Sunrisers Hyderabad | 69 | 43 | 26 | 62.3% |
| Deccan Chargers | 18 | 3 | 15 | 16.7% |
| Kolkata Knight Riders | 10 | 7 | 3 | 70.0% |
| Mumbai Indians | 14 | 9 | 5 | 64.3% |
| Delhi Capitals | 10 | 6 | 4 | 60.0% |
| Royal Challengers Bengaluru | 13 | 4 | 9 | 30.8% |
| Punjab Kings | 14 | 4 | 10 | 28.6% |
| Rajasthan Royals | 10 | 3 | 7 | 30.0% |
| Chennai Super Kings | 8 | 3 | 5 | 37.5% |
| Lucknow Super Giants | 4 | 3 | 1 | 75.0% |
SRH have the most wins: 43 in 69 decided matches (62.3%). Their opponents won the other 26. The no result against Delhi in May 2025 is excluded from this win rate. SRH’s record includes the 2013 Super Over win. Deccan Chargers’ earlier 3–15 record is shown separately because they were a different franchise.
Among teams with at least five decided venue matches, Kolkata Knight Riders have the best win rate at 70.0% (7/10). Lucknow’s 75.0% is based on only four matches and therefore does not meet this threshold. Historical franchise name changes are grouped for Delhi, Punjab and RCB.
| Team record | Result |
|---|---|
| Largest win by runs | SRH beat RCB by 118 runs on 31 March 2019 — 231/2 against 113 all out |
| Largest win by wickets | SRH beat LSG by 10 wickets on 8 May 2024 — 167/0 in 9.4 overs chasing 166 |
| Highest successful chase | SRH reached 247/2 in 18.3 overs against PBKS’s 245/6, 12 April 2025 |
| Highest total successfully defended | SRH 286/6 beat RR 242/6 by 44 runs, 23 March 2025 |
5. Batting First vs Chasing: What Do the Numbers Reveal?
| Measure | Figure / scope |
|---|---|
| Batting-first side match wins | 40 of 89 decided matches — 44.9% |
| Second-innings side match wins | 49 of 89 — 55.1%; includes one Super Over win |
| Successful regulation-innings chases | 48 across the 89 decided matches; one additional second-innings side won after a tie |
| First-innings average | 169.71 — 87 completed games with unadjusted 20-over allocations |
| Second-innings average | 158.17 — same 87-game sample |
| Toss winner also won the match | 33 of 89 — 37.1%; includes the Super Over result |
The 49 second-innings-side wins are not 49 completed run chases. On 7 April 2013, SRH and RCB both scored 130; SRH then won the Super Over. We keep that match in team win totals but distinguish it from a successful regulation chase. The two D/L games are included in the overall result split, not the scoring-average sample.
Second-innings averages are naturally affected by chases ending as soon as the target is reached. A lower average does not prove that the pitch became harder to bat on. Likewise, the historical chasing-side advantage is not an automatic instruction to bowl first: team strength, the surface and match-day conditions still need to be assessed in the Rajiv Gandhi Stadium pitch report.
| Target range | Matches | Chases achieved | Success rate | Ties |
|---|---|---|---|---|
| Below 150 | 33 | 23 | 69.7% | 1 |
| 150–179 | 23 | 14 | 60.9% | 0 |
| 180–199 | 12 | 5 | 41.7% | 0 |
| 200–219 | 11 | 3 | 27.3% | 0 |
| 220+ | 8 | 1 | 12.5% | 0 |
Target ranges use first-innings runs + 1, so they differ slightly from the first-innings score bands below. Tied regulation innings count in the denominator but not as achieved chases. Rain-adjusted targets are excluded.
6. Highest-scoring IPL Matches and Successful Chases
| Date | First innings | Second innings | Combined | Result |
|---|---|---|---|---|
| 23 Mar 2025 | SRH 286/6 | RR 242/6 | 528 | SRH won by 44 runs |
| 27 Mar 2024 | SRH 277/3 | MI 246/5 | 523 | SRH won by 31 runs |
| 12 Apr 2025 | PBKS 245/6 | SRH 247/2 | 492 | SRH won by 8 wickets |
| 22 May 2026 | SRH 255/4 | RCB 200/4 | 455 | SRH won by 55 runs |
| 21 Apr 2026 | SRH 242/2 | DC 195/9 | 437 | SRH won by 47 runs |
The SRH–RR game in March 2025 produced 528 runs, five more than the SRH–MI match in March 2024. The top five combined totals in this dataset all came in 2024–2026. That makes 528 an extreme result within a broader recent scoring rise, rather than the only high-scoring game in an otherwise unchanged history.
| Date | Target | Successful chase | Overs | Winner |
|---|---|---|---|---|
| 12 Apr 2025 | 246 | 247/2 | 18.3 | SRH |
| 24 Apr 2008 | 215 | 217/7 | 19.5 | RR |
| 19 May 2024 | 215 | 215/6 | 19.1 | SRH |
| 14 May 2014 | 206 | 211/4 | 18.4 | PBKS |
| 29 Mar 2019 | 199 | 201/5 | 19.0 | SRH |
Chase record: SRH’s 247/2 against PBKS is the final score; 246 was the target. Rajasthan Royals’ 217/7 chasing 215 in 2008 and SRH’s 215/6 chasing 215 in 2024 are separate successful-chase records, even though both targets were 215.
7. How Hyderabad’s IPL Scoring Pattern Has Changed
| Period | Matches | 1st-innings avg | 180+ totals | 200+ totals | Highest |
|---|---|---|---|---|---|
| 2008–2015 | 33 | 157.24 | 7/33 | 4/33 | 223 |
| 2016–2022 | 29 | 160.28 | 8/29 | 4/29 | 231 |
| 2023–2026 | 25 | 197.12 | 16/25 | 11/25 | 286 |
The early periods averaged 157.24 and 160.28. The 2023–2026 average was 197.12, with 16 of 25 first innings reaching 180 and 11 of 25 reaching 200. This is a stronger basis for discussing the modern scoring environment than quoting the all-time 169.71 average alone.
Season-wise first-innings scoring
| IPL season | Matches | Average | Highest | Bat-first wins |
|---|---|---|---|---|
| 2008 | 7 | 173.43 | 214 | 2 |
| 2011 | 7 | 161.29 | 175 | 3 |
| 2012 | 4 | 153.75 | 187 | 2 |
| 2013 | 8 | 134.62 | 223 | 3 |
| 2014 | 4 | 166.00 | 205 | 0 |
| 2015 | 3 | 163.33 | 192 | 2 |
| 2016 | 6 | 148.83 | 194 | 1 |
| 2017 | 8 | 164.50 | 209 | 6 |
| 2018 | 7 | 152.43 | 182 | 3 |
| 2019 | 8 | 171.50 | 231 | 5 |
| 2023 | 7 | 174.43 | 203 | 4 |
| 2024 | 6 | 204.67 | 277 | 3 |
| 2025 | 5 | 203.20 | 286 | 1 |
| 2026 | 7 | 209.00 | 255 | 5 |
The 2026 sample contains seven matches, averaging 209.00 in the first innings, with five batting-first wins. In 2025, the five qualifying matches averaged 203.20, but only one was won batting first. These small season samples show why a high average and a preferred innings order should not be treated as the same thing. Seasons without qualifying games at this venue are omitted.
8. What Is a Competitive IPL Score at Rajiv Gandhi Stadium?
The historical median first innings is 165 and the average is 169.71, but the recent period averages almost 197. A practical reading is to treat 180–199 as competitive rather than automatically safe, and 200+ as a stronger starting point in the recent scoring environment. These are interpretations of past results, not guaranteed winning totals.
| First-innings score | Matches | Defended | Defend rate |
|---|---|---|---|
| Below 150 | 34 | 10/34 | 29.4% |
| 150–179 | 22 | 8/22 | 36.4% |
| 180–199 | 12 | 7/12 | 58.3% |
| 200–219 | 11 | 8/11 | 72.7% |
| 220+ | 8 | 7/8 | 87.5% |
Below 150, batting-first teams won only 10 of 34 games. At 200–219, they won 8 of 11. At 220+, they won 7 of 8; the exception was PBKS’s 245/6, chased by SRH in April 2025. The 220+ sample is small, and the score bands combine different seasons and teams. They show association, not the isolated effect of pitch conditions.
9. Powerplay and Death-over Records
| Phase record | Figure | Match |
|---|---|---|
| Highest powerplay runs | 107/0 — SRH | vs LSG, 8 May 2024 |
| Most runs in overs 16–20 | 87 — CSK | vs SRH, 8 May 2013; innings 223/3 |
| Most wickets lost in overs 16–20 | 8 — SRH | vs DC, 14 April 2019; 116 all out in 18.5 overs |
| Most credited powerplay wickets, career | Bhuvneshwar Kumar — 20 | Overs 1–6 at this venue |
| Most credited death-over wickets, career | Bhuvneshwar Kumar — 26 | Overs 16–20 at this venue |
Powerplay runs cover deliveries in overs 1–6; death-over figures cover overs 16–20, including extras. SRH’s 107/0 was a full six-over powerplay, although their chase ended at 9.4 overs. The eight-wicket collapse occurred within the final-five-over window but ended at 18.5, not after five full death overs. Team wickets lost include run-outs; bowler totals do not. Super Over deliveries are excluded.
10. Records and Calculations
Player runs exclude extras; batting average is runs divided by dismissals, and strike rate is runs per 100 balls faced. Bowling average is runs charged to the bowler divided by credited wickets. Economy uses legal deliveries converted to overs, with byes and leg-byes excluded from the bowler’s runs. Figures are rounded to two decimal places. Boundaries mean fours and sixes scored off the bat.
Team win percentages use decided matches, including the Super Over winner. Scoring trends and score-band tables use the 87 completed matches with unadjusted 20-over allocations, not only innings that lasted 20 overs. First-innings average is the sum of those first-innings totals divided by 87; the median is their middle value when sorted. Dataset venue aliases are Rajiv Gandhi International Stadium; Rajiv Gandhi International Stadium, Uppal; and Rajiv Gandhi International Stadium, Uppal, Hyderabad.
PitchVaani Perspective: What the Hyderabad IPL Records Reveal
Hyderabad’s scoring ceiling has risen, but the useful benchmark is the recent 197.12 first-innings average, not simply SRH’s 286/6 record. The 200–219 band has been defended in 8 of 11 games; the 220+ band in 7 of 8. Both samples are small enough that a record total should never be sold as a certainty.
SRH’s 43 wins show a real home-results advantage. Warner’s run volume and Abhishek’s scoring speed explain different kinds of batting success, while Steyn, Rashid and Kaul show why bowling records deserve equal attention. Use these numbers with the match-day surface and team context, not as a substitute for them.
Interpretation based on the stated venue dataset through 22 May 2026; reviewed 12 October 2026.More Rajiv Gandhi Stadium Guides
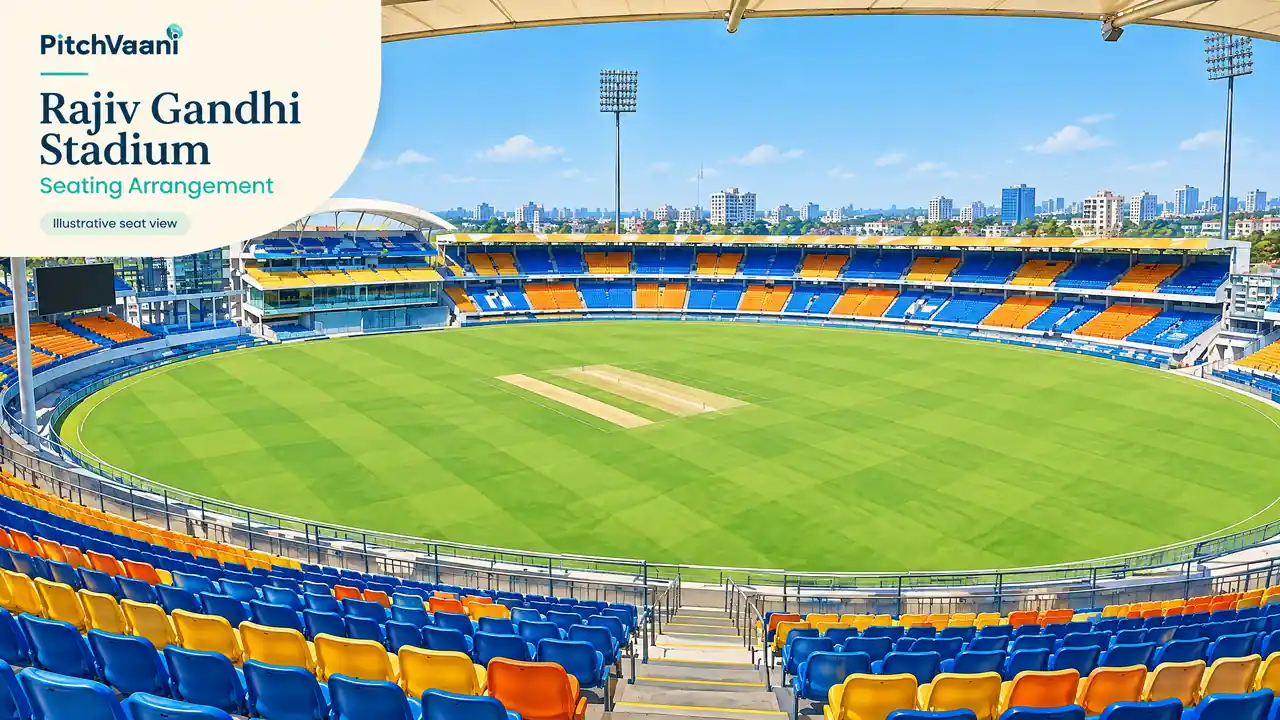
For a match-day visit, compare the Rajiv Gandhi Stadium seating arrangement before choosing a stand. If you arrive by rail, the train guide from Secunderabad and other Hyderabad stations explains onward travel. Drivers can use the Uppal Stadium parking guide.
The format-specific stadium records cover international cricket separately. Browse all the connected venue articles in Rajiv Gandhi Stadium Related Blogs on PitchVaani.

Frequently Asked Questions
What is the highest IPL score at Rajiv Gandhi Stadium?
SRH scored 286/6 against Rajasthan Royals on 23 March 2025. RR replied with 242/6, giving SRH a 44-run win and a combined match total of 528.
Who has scored the most IPL runs at Rajiv Gandhi Stadium?
David Warner leads with 1,623 runs in 32 innings, at an average of 64.92 and a strike rate of 160.53, through the latest completed venue IPL match on 22 May 2026.
Who has taken the most IPL wickets at Hyderabad?
Bhuvneshwar Kumar leads with 48 wickets. Amit Mishra has 30, Rashid Khan 28, Dale Steyn 27 and Siddarth Kaul 21.
What are the best IPL bowling figures at Uppal?
Alzarri Joseph’s 6/12 for Mumbai Indians against SRH on 6 April 2019 are the venue’s best IPL bowling figures. SRH were dismissed for 96.
What is the highest successful IPL chase at Hyderabad?
SRH reached 247/2 in 18.3 overs against Punjab Kings on 12 April 2025. PBKS had made 245/6, so the target was 246.
Do teams batting first or chasing win more often?
The second-innings side won 49 of 89 decided matches, compared with 40 wins for the batting-first side. Those 49 include one Super Over win after a tie; there were 48 successful regulation chases.
What is a competitive IPL score at Rajiv Gandhi Stadium?
The 87-match first-innings average is 169.71 and the median is 165, but the 2023–2026 average is 197.12. Historically, 200–219 was defended in 8 of 11 matches and 220+ in 7 of 8. These are past results, not guarantees.
How many IPL matches are included in these records?
The ball-by-ball dataset includes 90 matches with play: 89 decided and one no result. Scoring trends use 87 completed matches after excluding two D/L games and the no result. The no-play abandonment on 16 May 2024 is excluded.