
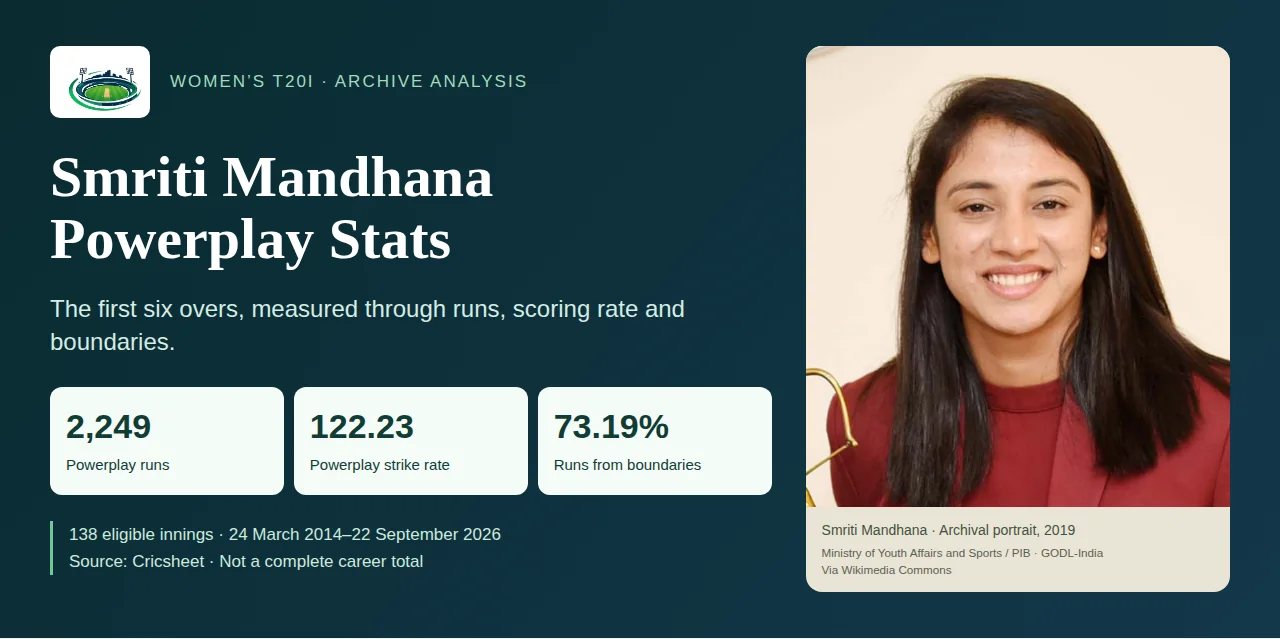
Smriti Mandhana Powerplay Stats: At a Glance
The first six overs of a T20 innings can shape the scoring rate before fielding restrictions ease. Powerplay statistics help show how effectively an opener scores during this phase, beyond the final innings total.
These Smriti Mandhana powerplay stats cover a defined sample of Women's T20Is in the Cricsheet archive.
PITCHVAANI · WOMEN’S T20I ANALYSIS
Smriti Mandhana: Powerplay Stats
Cricsheet archive · 24 Mar 2014 – 22 Sep 2026
- Powerplay runs
- 2,249
- Across 138 eligible innings
- Strike rate
- 122.23
- Runs per 100 balls
- Balls faced
- 1,840
- First six overs
- Total boundaries
- 391
- 350 fours · 41 sixes
Runs from boundaries
1,646 runs
Share of her powerplay runs
These are focused Smriti Mandhana T20I stats: the archive contains completed, full-length scheduled 20-over Women’s T20Is in which Mandhana batted during her team’s first six overs. It is an archive sample rather than a claim about every innings of her career.
How Many Runs Has Smriti Mandhana Scored in the Powerplay?
In the 138 eligible innings, Mandhana scored 2,249 runs from 1,840 balls in the first six overs. These Smriti Mandhana runs in first 6 overs are the central measure in this analysis. That produces a powerplay strike rate of 122.23. The count is based on batter runs: wides are not balls faced, while no-ball deliveries faced are counted as deliveries.
POWERPLAY RUNS
2,249
Runs in the first six overs across 138 eligible innings.
- Balls faced
- 1,840
- Average runs per eligible innings
- 16.30
POWERPLAY STRIKE RATE
122.23
Runs scored per 100 balls faced.
FULL-INNINGS STRIKE RATE
129.46
Across the same 138-innings cohort.
POWERPLAY VS FULL INNINGS
Shared scale: 0–129.46 runs per 100 balls faced.
Her powerplay strike rate is 7.23 runs per 100 balls lower than her full-innings rate in this sample.
For comparison, her complete innings in this same cohort totalled 4,157 runs from 3,211 balls at 129.46. The six-over figure therefore captures a slightly lower aggregate scoring rate than her full-innings rate in the coverage-matched sample. It should not be read as a limitation on her ability to attack early; it describes the combined result of very quick starts, quiet starts and innings that ended during the fielding restriction.
For current match context, PitchVaani’s India Women versus Zimbabwe Women third T20I preview sits outside this archive cut-off. That distinction matters when a live result is discussed alongside historical powerplay totals.
Smriti Mandhana’s Powerplay Strike Rate
Smriti Mandhana’s powerplay strike rate in this sample is 122.23, compared with 129.46 for her full innings in the same 138 matches. Her after-powerplay runs—only the innings that continued beyond six overs—came at 139.17 from 1,371 balls (1,908 runs).
SMRITI MANDHANA · WOMEN’S T20Is
| Powerplay | After 6 overs | Full innings |
|---|---|---|
| 122.23 | 139.17 | 129.46 |
| 1,840 balls | 1,371 balls | 3,211 balls |
At career level, a separate Cricbuzz profile context lists 4,923 runs from 3,849 balls in its T20I match history, which works out to about 127.9. That secondary-source career denominator does not match the Cricsheet powerplay cohort, so the direct comparison here uses 129.46, the full-innings rate from the same 138 innings.
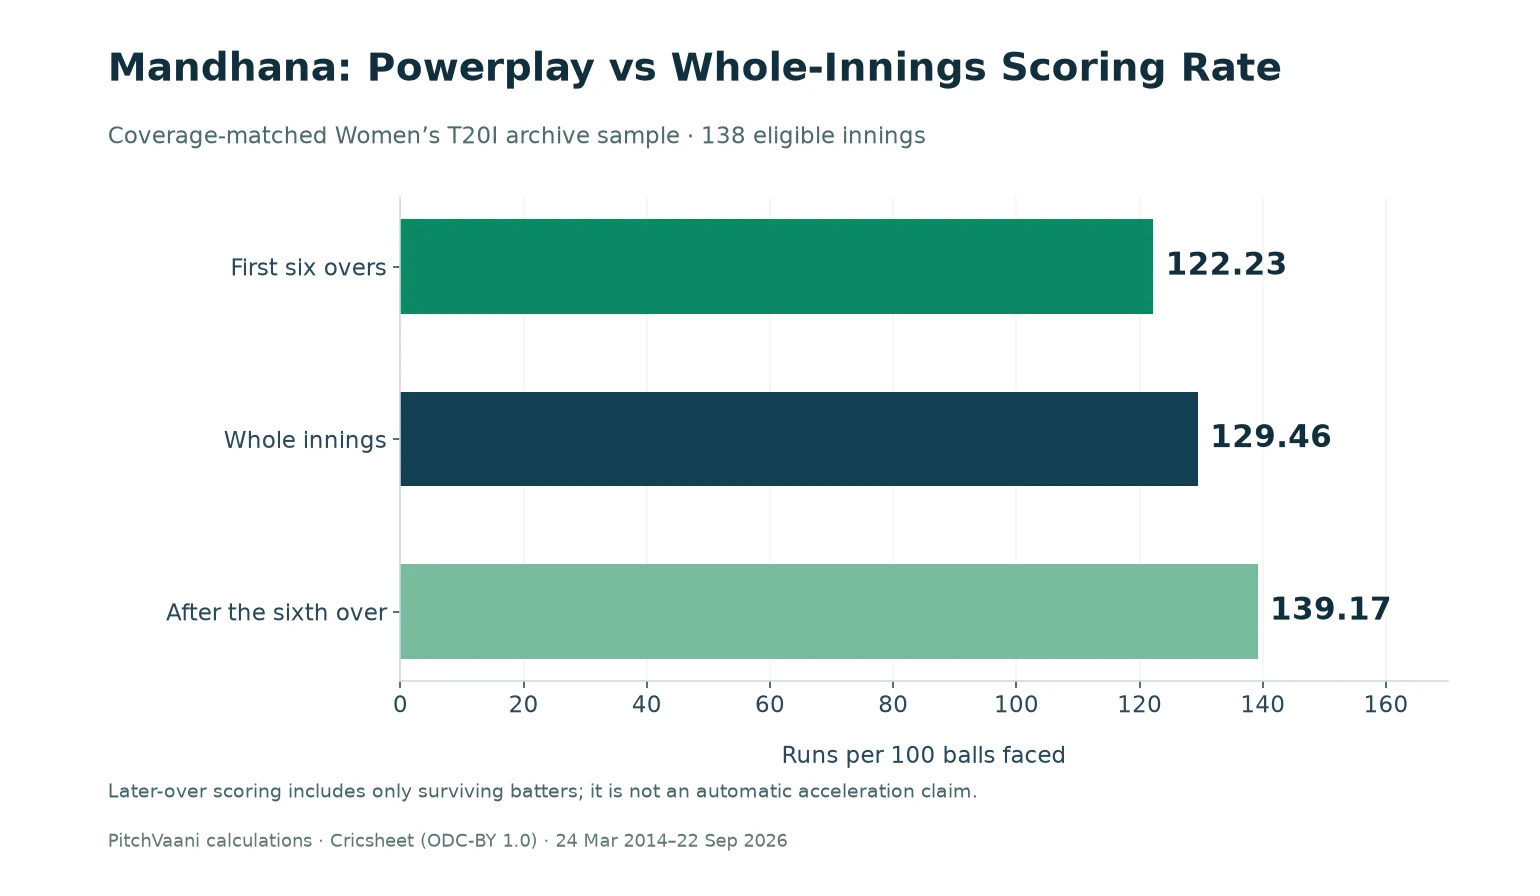
Read the chart values
- First six overs:2,249 runs from1,840balls; strike rate 122.23.
- Whole innings: 4,157 runs from 3,211 balls; strike rate 129.46.
- After the sixth over: 1,908 runs from 1,371 balls; strike rate 139.17.
Smriti Mandhana’s Powerplay Boundary Analysis
BOUNDARY-RUN SHARE · POWERPLAY
73.19%
1,646 of 2,249 powerplay runs came from fours and sixes.
- Fours
- 350
- 1,400 runs
- Sixes
- 41
- 246 runs
POWERPLAY VS FULL INNINGS
- Powerplay boundary share
- 73.19%
- Full-innings boundary share
- 67.89%
5.30 percentage points higher
Boundaries account for a larger share of Mandhana’s runs during the first six overs than across her complete innings in this sample.
What Do These Numbers Reveal?
The key finding is that Mandhana’s powerplay scoring is strongly boundary-dependent in this sample. Fours supplied 1,400 runs, compared with 246 from sixes. Her boundary scoring therefore came mainly through fours, rather than shots clearing the rope.
The 73.19% boundary-run share was 5.30 percentage points above her full-innings share of 67.89%. The remaining 603 powerplay runs came through other batter scoring, including singles, twos and threes. These are shares of runs, not percentages of deliveries that went for a boundary.
Recent Sample: An Even Stronger Boundary Contribution
77.61%
30 fours · 6 sixes · Most recent 10 included archive innings
21 June – 22 September 2026
In that ten-innings archive sample, boundaries supplied 77.61% of her powerplay runs, compared with 73.19% in the full 138-innings cohort. That is a higher boundary contribution in the selected sample, but it does not establish a permanent change in her approach or predict her next innings. It is not a current-career or October match sample.
The most recent included archive sample is even more boundary-dependent: 30 fours and six sixes produced 156 of 201 powerplay runs, or 77.61%. Those are descriptive shares, not forecasts of the next innings. Pitch conditions can vary; the Raipur pitch report provides separate venue context rather than changing these archive calculations.
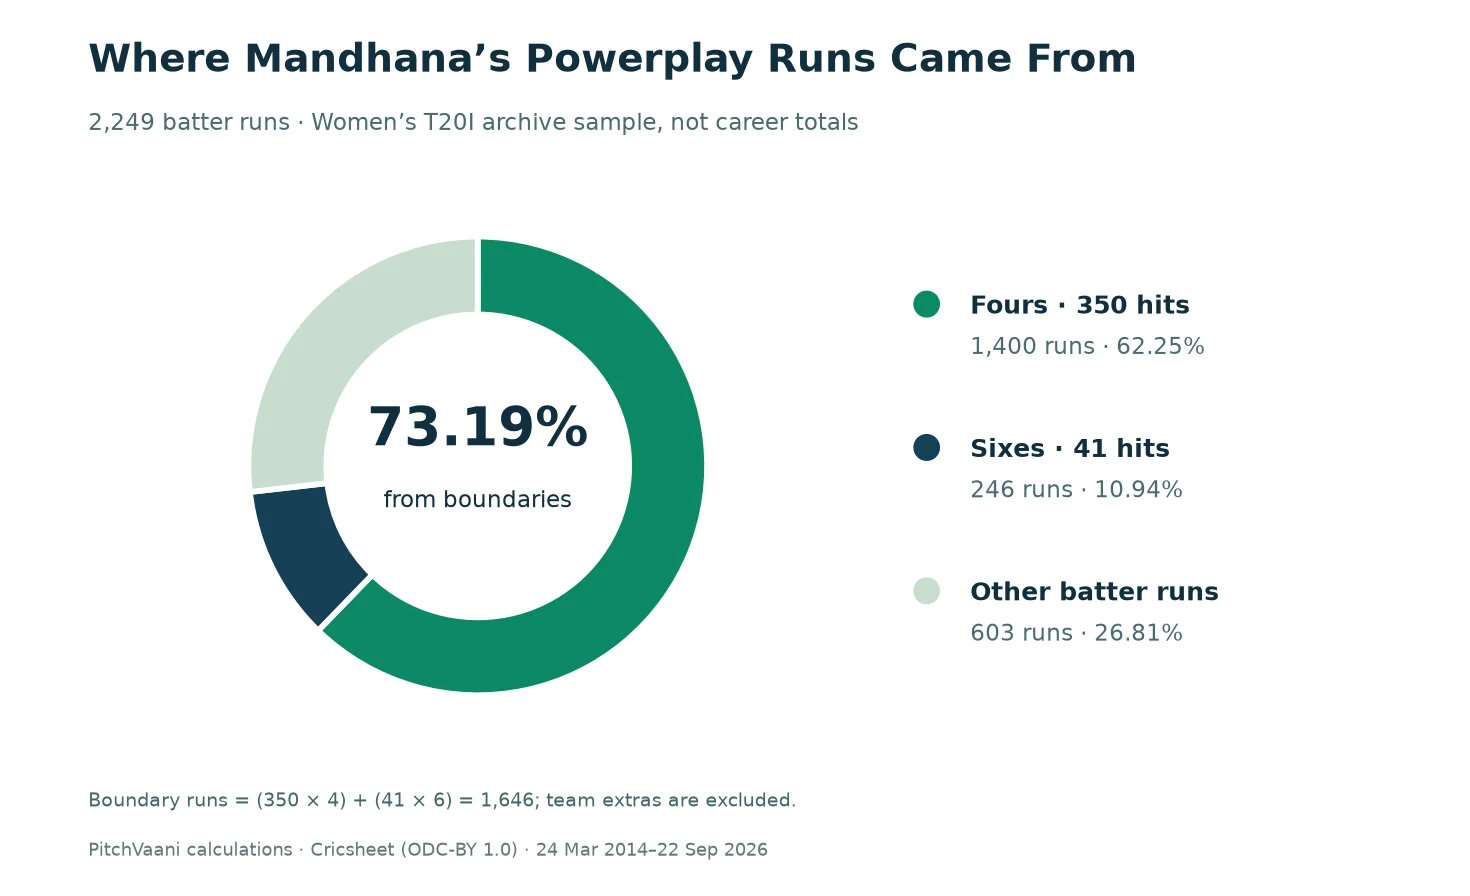
Read the chart values
- 350 fours: 1,400 runs.
- 41 sixes: 246 runs.
- Other batter runs: 603.
- Boundary share: 1,646 / 2,249 × 100 = 73.19%.
Does Smriti Mandhana Start Fast or Build Her Innings?
Across all 138 eligible archive innings, her powerplay record shows 53 reached at least 20 powerplay runs (38.41%), 32 recorded a powerplay strike rate strictly above 150 (23.19%), and 70 ended with a powerplay dismissal (50.72%). These counts use all 138 innings as the denominator.
POWERPLAY PERFORMANCE · 138 INNINGS
53
Reached 20+ runs
38.41%
Of eligible innings
32
Strike rate above 150
23.19%
Of eligible innings
70 of 138
Dismissed during the powerplay
The sample supports a mixed description rather than a single label. Mandhana can impose a fast start—especially when boundaries arrive—but many innings do not cross either threshold. The after-powerplay rate is also affected by survivor selection: only batters who remain in for later overs can contribute to that 139.17 figure. These are descriptive sample results, not automatic evidence of individual acceleration or next-match probability.
Smriti Mandhana’s Recent Powerplay Form
For a defined view of Smriti Mandhana recent T20I form, the table below shows the last 10 included archive innings, not her actual latest 10 innings as of 19 October 2026. They run from 21 June to 22 September 2026 because the 16 and 18 October Zimbabwe matches postdate the Cricsheet archive cut used here. Across these ten innings, she scored 201 runs from 147 balls at 136.73, with 30 fours, six sixes and a 77.61% boundary-run share. Four innings reached 20 powerplay runs, three exceeded a 150 strike rate, and six ended in powerplay dismissals.
| Date | Opponent | PP runs / balls | Fours | Sixes | Six-over endpoint | Full innings |
|---|---|---|---|---|---|---|
| 21 Jun 2026 | South Africa | 17 / 12 | 3 | 0 | 17 out before six overs | 17 off 12 |
| 25 Jun 2026 | Bangladesh | 8 / 6 | 1 | 0 | 8 out before six overs | 8 off 6 |
| 28 Jun 2026 | Australia | 22 / 22 | 4 | 0 | 22* after six overs | 38 off 37 |
| 30 Aug 2026 | Thailand | 19 / 10 | 4 | 0 | 19 out before six overs | 19 off 10 |
| 3 Sep 2026 | Hong Kong | 30 / 24 | 5 | 0 | 30* after six overs | 124 off 64 |
| 5 Sep 2026 | Pakistan | 9 / 11 | 2 | 0 | 9 out before six overs | 9 off 11 |
| 10 Sep 2026 | Bangladesh | 2 / 5 | 0 | 0 | 2 out before six overs | 2 off 5 |
| 13 Sep 2026 | Sri Lanka | 19 / 17 | 3 | 0 | 19* after six overs | 59 off 39 |
| 20 Sep 2026 | Bangladesh | 37 / 19 | 5 | 2 | 37 out before six overs | 37 off 19 |
| 22 Sep 2026 | Sri Lanka | 38 / 21 | 3 | 4 | 38* after six overs | 79 off 45 |
The recent archive rate is 14.50 strike-rate points above the all-sample powerplay rate (136.73 versus 122.23). That is a useful sample comparison, not a statistically significant form claim and not a prediction for the next match; the opponents and sample size are uneven.
For separate current context, Mandhana made 47* from 25 balls at a strike rate of 188.0 against Zimbabwe in Raipur on 18 October 2026, with six fours and two sixes. That is a full-innings score, not her powerplay score. This full innings is documented by the official BCCI video and the Cricbuzz match history. The first-six-over split is not available for this match in the archive used here.
What Do the Numbers Tell Us About Her Batting?
1. Attacking starts are part of her game
122.23
Powerplay strike rate
She exceeded a powerplay strike rate of 150 in 32 eligible innings, but only 53 reached 20 powerplay runs. Her aggregate rate does not mean every start was rapid or that a substantial score is guaranteed.
2. Boundaries drive early scoring
73.19%
Powerplay runs from boundaries
Nearly three-quarters of her powerplay runs came from fours and sixes. The recent ten-innings archive sample recorded a higher boundary share of 77.61%, but that smaller sample does not establish a lasting trend.
3. Early impact and survival both matter
50.72%
Innings ending in a powerplay dismissal
Her early scoring cannot be evaluated from strike rate alone. Dismissals and lower-scoring starts are part of the record, while later-over statistics represent only innings that continued beyond six overs.
Overall assessment
Smriti Mandhana’s powerplay profile in this sample is boundary-led and capable of high-rate starts, but not uniformly explosive. These aggregate figures describe how she scored across the included innings; they do not mean every innings followed the same pattern or predict what she will score next.
For readers checking the surrounding series information, PitchVaani’s third T20I squads page and second T20I fixtures and results page are separate match resources. They are not substituted for the ball-by-ball denominator used in this analysis.
FAQ
What is Smriti Mandhana’s powerplay strike rate?
It is 122.23 in the 138-innings Cricsheet Women’s T20I archive sample, calculated from 2,249 runs off 1,840 balls in the first six overs.
How many runs has Smriti Mandhana scored in the first six overs?
She scored 2,249 powerplay runs in the defined archive sample covering 24 March 2014 to 22 September 2026.
How many boundaries does Smriti Mandhana hit in the powerplay?
The sample records 350 fours and 41 sixes. Together they account for 1,646 runs, or 73.19% of her 2,249 powerplay runs.
What is Smriti Mandhana’s T20I strike rate?
A separate current Cricbuzz career context gives 4,923 runs from 3,849 balls in its T20I match history, which is about 127.9. That is not the same denominator as the Cricsheet powerplay cohort; the cohort’s full-innings rate is 129.46.
Is the recent table Mandhana’s actual latest ten innings?
No. It is the last ten included archive innings, from 21 June to 22 September 2026. The 16 and 18 October Zimbabwe matches came after the archive cut; the 18 October 47* is therefore shown only as separate current full-innings context.
More from PitchVaani

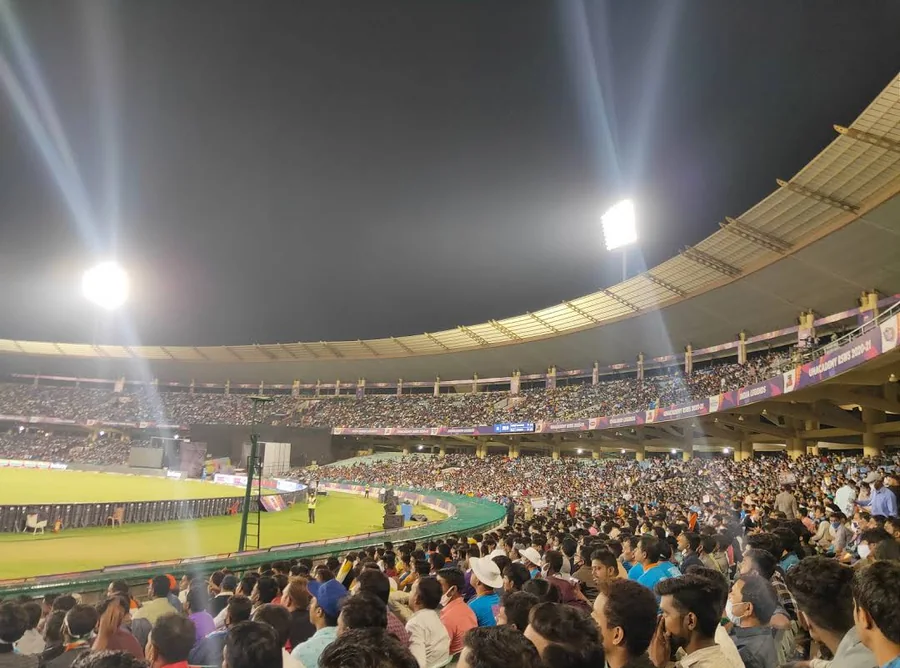
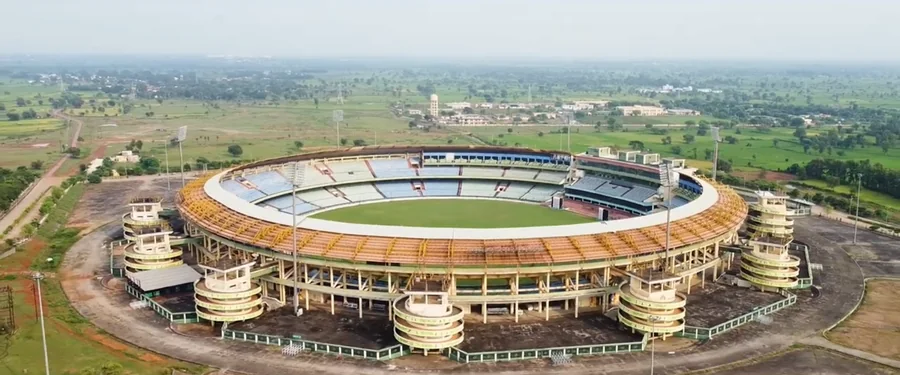
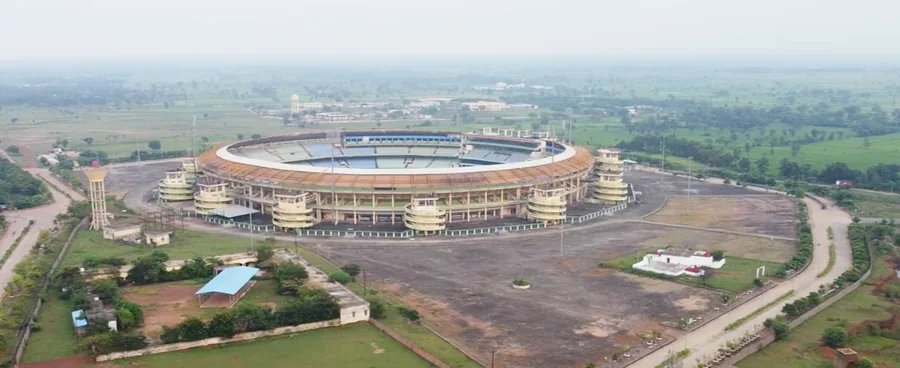

Photo credits
Archival photographs by VishuN via Wikimedia Commons: Overview photograph (CC BY-SA 4.0) · History photograph (CC BY-SA 4.0) · Matches photograph (CC0 1.0) · Records photograph (CC BY-SA 4.0). Resized and converted to WebP; PitchVaani logos displayed as overlays. CC BY-SA 4.0 · CC0 1.0.